“Doing research and presenting it sparked a passion I didn’t know I had.”
By Katie Neitz
Several geology and environmental geosciences students recently presented their research at two regional conferences: the Northeast Section Meeting of the Geologic Society of America in Portland, Maine, and the Southeast Section Meeting of the Geologic Society of America in Charleston, S.C.
Faculty members from the department also shared their own expertise during research talks and seminars at both meetings. At the Northeast GSA meeting, Tamara Carley, assistant professor of geology, delivered a talk and chaired a session on the geology and evolution of Iceland; Dru Germanoski, Van Artsdalen Professor of Geology and Environmental Geosciences and co-chair of environmental science and studies, spoke about his multidisciplinary monitoring of Bushkill Creek dams. David Sunderlin, associate professor of geology, spoke at the Southeast GSA meeting about tracking palms in the fossil record and how that reflects paleoclimate and evolutionary history.
In addition, Mary Elizabeth Conners ’18 presented research at the Northeast meeting about the compositional evolution of an Icelandic volcano, research that she conducted with Carley during their time together at Lafayette.
The opportunity to present research at a professional scientific conference is extremely valuable, especially for undergraduate students. Students learn from the questions and feedback they receive, hone their presentation skills, and expand their professional networks by talking and sharing insights with the wider geological community.
Learn more about each student’s research—plus challenges hurdled and lessons learned along the way. Below, each student shares their own experience.
Kamal Bookwala ’20
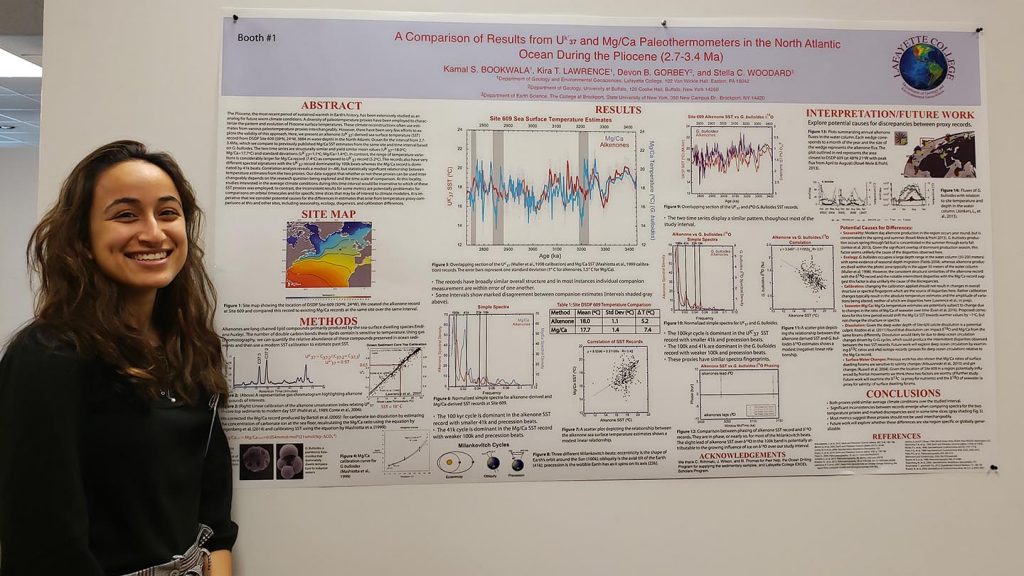
“It was the first time I presented at a geology conference, and it was great to get feedback from other people who have studied similar paleoclimatology and to be able to learn from them,” says Kamal Bookwala.
My advisor: Kira Lawrence, John H. Markle Professor of Geology and department head
My research: A Comparison of Results from Uk’37 and Mg/Ca Paleothermometers in the North Atlantic During the Pliocene
What that means: “Scientists often study the temperatures of the surface of the ocean through time to understand how climate has changed. Not only does the ocean cover about 70 percent of Earth, but also the water has higher heat capacity and thermal inertia than the land surface. The time period that I helped study, the Pliocene, is the most recent period of sustained warmth in Earth’s history. This specific period of time is extensively studied as an analog for future warm climate conditions. Today, paleoclimatologists use a diverse set of paleotemperature proxies (indicators of past climate), sometimes interchangeably, in order to characterize the pattern and evolution of Pliocene sea surface temperatures. My research looks into comparing two of these paleotemperature proxies. We looked at alkenone (Uk’37) derived sea surface temperature record from DSDP Site 609 in the North Atlantic Ocean for the interval from 2.7-3.4 Ma. We compared these records to previously published Mg/Ca SST estimates from the same site and time interval.”
What I found: “Our data shows considerable similarity between the estimates on longer timescales, but suggests the inconsistencies in the temperature results from the two different proxy methods are potentially problematic for comparisons on orbital timescales (thousands of years). This means that we must now try to understand the potential causes for the differences in the estimates of the two different temperature proxy methods.”
My biggest challenge: “Since our two different proxy methods have some periods of stark differences throughout the record, we are now trying to understand the potential causes of those differences.”
What I learned: “It was the first time I presented at a geology conference, and it was great to get feedback from other people who have studied similar paleoclimatology and to be able to learn from them. After two years of working on this research, it was really wonderful being able to see it come together for a poster. I hope to pursue a Ph.D. after graduating from Lafayette and eventually join academia, so conducting research and presenting at conferences will hopefully be a very core aspect of my future.”
Anna Golub ’19
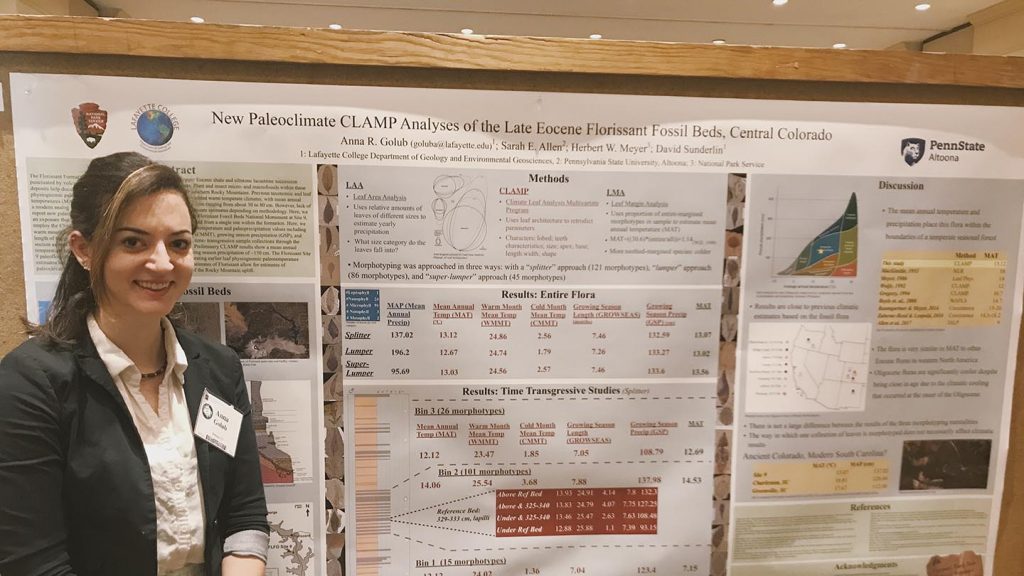
“Presenting at GSA was so much fun! It’s always beneficial to discuss research with other educated people in the field,” says Anna Golub.
My advisor: Sunderlin
My research: New Paleoclimate CLAMP Analyses of the Late Eocene Florissant Fossil Beds, Central Colorado
What that means: “I looked at plant macrofossil morphology—basically the architecture/form of fossil leaves—in order to better understand and reconstruct climate variables of the Southern Rocky Mountains approximately 40 million years ago. I examined a collection of fossil leaves from one rock layer in Florissant Fossil Beds National Monument and then split that collection into three time-transgressive bins to examine potential climatic change over time based on the abundance of the leaves of different morphology. The rock layer is a succession of ancient lake deposits punctuated by volcanic events, and I also analyzed the flora below and above the volcanic event to assess any biotic response to the volcanic eruption. In order to assess all of these climatic variables, I utilized two different univariate analysis programs and one multivariate analysis program.”
What I found: “All of my three methods support each other’s results in placing the leaf collection within the zone of a temperate seasonal forest. My study assigns this late Eocene flora a mean annual temperature of 13 C, mean annual precipitation of 137 centimeters, a warm month mean temperature of 25 C, cold month mean temperature of 3 C, and seven- to eight-month-long growing season. The three time-transgressive bins did reflect changes in climate; however, I’m not entirely sure it’s reliable just because the number of morphotypes (basically ancient species) analyzed in some of the bins is unfortunately very low and therefore not necessarily significant in the multivariate analyses. The same is true of the volcanic event study.”
My biggest challenge: “There were definitely challenging aspects to this research. One that stands out is dealing with not having enough significant data for the time-transgressive and volcanic reference bed studies, which was pretty frustrating for me.”
What I learned: “In addition to the climatic results, I learned so much about doing my own independent research, and how tedious some aspects can be but also how rewarding it is. Presenting at GSA was so much fun! It’s always beneficial to discuss research with other educated people in the field. My research is definitely helping to shape my future. I love the atmosphere of academia and plan on applying to grad school within the next two years, and am considering a few different specific fields of study including paleobotany.”
Emilie Henry ’19
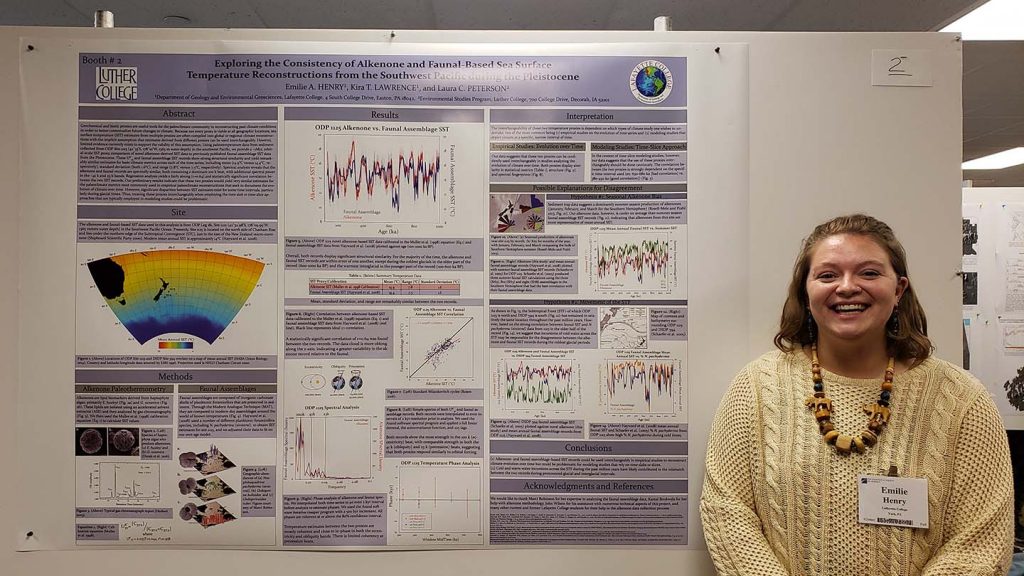
“I really got a sense of what kind of vibes the geologic community gives off, and I felt really at home,” says Emilie Henry.
My advisor: Lawrence
My research: Exploring the Consistency of Alkenone and Faunal-Based Sea Surface Temperature Reconstructions from the Southwest Pacific During the Pleistocene
What that means: “In the simplest terms, I’m studying mud that was deposited on the bottom of the ocean over the course of the past million years. There are a number of different methodologies climate scientists have devised using this mud to determine what the climate conditions were like way back then. Essentially, I’m comparing two of these methodologies for mud from a specific site in the southwest Pacific Ocean to determine if they give us similar or different depictions of paleoclimate conditions and in the places where they don’t agree, trying to decipher why that’s the case.”
What I found: “Reassuringly, the two methodologies generally produce the same or similar climate depictions over the past million years, with a few notable exceptions. In the older half of the record (between 600,000 and 1 million years before present), there is one extremely cold glacial period in which the two methods disagree. Also, in the earlier part of the record (between 100,000 and 600,000 years before present), there is one extremely warm interglacial in which there’s significant disagreement too.”
My biggest challenge: “The preliminary research, for which I read over 35 scientific papers, was the hardest part for me. There are a whole slew of other comparison studies like the one I’m doing, so trying to figure out which ones would be useful for my research and which ones were less relevant was really difficult.”
What I learned: “I know that I definitely want to pursue a career as a geologist. Whether or not I stay in this particular realm of geology is still to be decided, but I definitely know that I’m in the field that I’m supposed to be. People came to my poster and listened to my spiel, but then also provided feedback and suggestions about moving forward. I really got a sense of what kind of vibes the geologic community gives off, and I felt really at home.”
Brian Pinke ’19
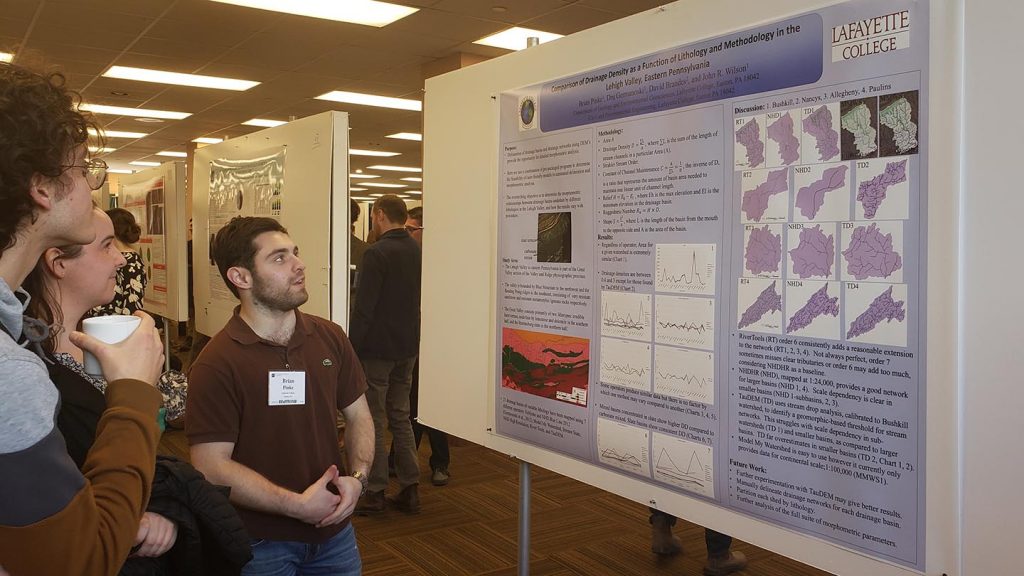
“Talking to geologists from all walks of life gave me a broader understanding of what I might want to do with my degree after graduating,” says Brian Pinke.
My advisor: Germanoski
My research: Comparison of Drainage Density as a Function of Lithology and Methodology in the Lehigh Valley, Eastern Pennsylvania
What that means: “Drainage density is useful due to its ability to directly compare two basins from equivalently scaled maps. However, it is important to note that the value is scale dependent due to the order of streams that can be included at the measurement at different scales. To obtain my data, I obtained drainage density values for 21 different drainage basins in the Lehigh Valley using different data sets and automated programs: StreamStats, Model My Watershed, River Tools, TauDEM, NCHydro 2012, National Hydrography Data Set High Resolution—the latter three of which required ArcMap GIS.”
What I found: “The drainage density in slate is higher than in carbonate, and this is true regardless of which mapping operator/data set I used. Importantly, the correlation becomes stronger as the basin is mapped with higher resolution. Also important is that the different mapping operators/data sets show significant differences in the drainage densities they provide. Unfortunately, the variance is not a constant factor. Overall, it is certainly possible to use automated software to delineate drainage networks; however, one must have a good understanding of the area to determine whether the data is reasonable or if modifications must be made.”
My biggest challenge: “The different directions this project pulled me in and the amount of data I had to deal with was definitely tricky. At times it seemed like I had a mountain of tasks to complete in order to obtain even a small part of the results I wanted. Part of the difficulty was that for each of the software packages or data sets I used, I had to learn how to use the software, each of which have varying learning curves, or use ArcMap GIS, which is a beast of its own in terms of making it do what you want it to. It’s definitely a rewarding feeling when the days of prep work to understand what I’m working with and setting everything up to run finally pays off, and the numbers and drainage networks start appearing on my screen.”
What I learned: “The conference experience was incredible with a plethora of networking opportunities, chances for idea exchange through poster sessions, and hundreds of talks each day. Being there gave me the opportunity to really test the waters of different geologic disciplines and see what I do and don’t like. Talking to geologists from all walks of life gave me a broader understanding of what I might want to do with my degree after graduating. This overall experience has had a pretty profound impact on my future career path.”
Leah Shteynman ’20
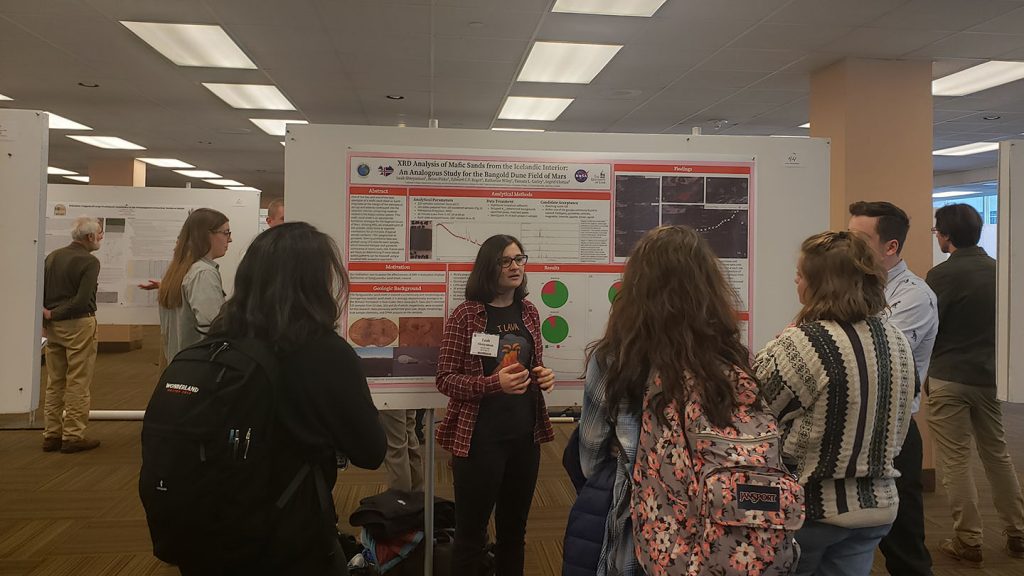
“After presenting I felt more confident in my own knowledge and decision-making, and I had a much clearer and more specific idea of where I wanted the project to go,” says Leah Shteynman.
My advisor: Carley
My research: XRD Analysis of Mafic Sands from the Icelandic Interior: An Analogue Study for the Bagnold Dune Field of Mars
What that means: “We used X-ray powder diffraction to try to identify the mineral makeup of Icelandic sands. The sands were gathered from different points on a sand sheet being blown off a glacier. By identifying the minerals present at different locations within the sand sheet, we attempted to discern spatial patterns of mineral distribution within the sand sheet. This specific sand sheet was previously determined to be analogous to a sand sheet on Mars that the next rover will be passing through, so the hope was that studying the Icelandic sands would both help us predict what we might see on Mars, as well as determining whether this particular tool (X-ray powder diffraction) would be useful in trying to see the patterns we were looking for.”
What I found: “The major finding was that we haven’t yet seen the patterns we were looking for, but that’s not to say we won’t. Our research is really a work-in-progress right now. Since presenting the poster, we have altered our methods in the hope that we will be able to find any spatial variation that may exist. If we still don’t see patterns with the altered methods, we can be more certain that there weren’t any to find.”
My biggest challenge: “The most challenging part of our research was attaining a high enough level of certainty that our results represented the ‘truth.’ We increased the number and length of trials, and we have done extra tests to check whether unexpected results are within a reasonable level of uncertainty. A good example of this is the fact that we found almost no olivine in our samples. Olivine, theoretically, should have been present in large quantities in every sample. This week, we will be adding a known quantity of olivine to one of our samples and analyzing it to see if it’s possible that other minerals are masking the olivine so the XRD can’t see it. If the olivine shows up in our analysis, we will be much more certain that our other samples really didn’t contain any, and we can start to wonder why that would be the case.”
What I learned: “We had a consistent crowd of people around the poster. I was so nervous that I wouldn’t know what to say or how to answer questions, but as I started talking everything came naturally. I realized while presenting that I knew a lot more about the research than I gave myself credit for. I was able to talk off the top of my head and answer every question I was asked. After presenting I felt more confident in my own knowledge and decision-making, and I had a much clearer and more specific idea of where I wanted the project to go. It was nice to have researchers outside Lafayette show interest in my work. Doing research and presenting it sparked a passion I didn’t know I had.”
Rebecca Webster ’19
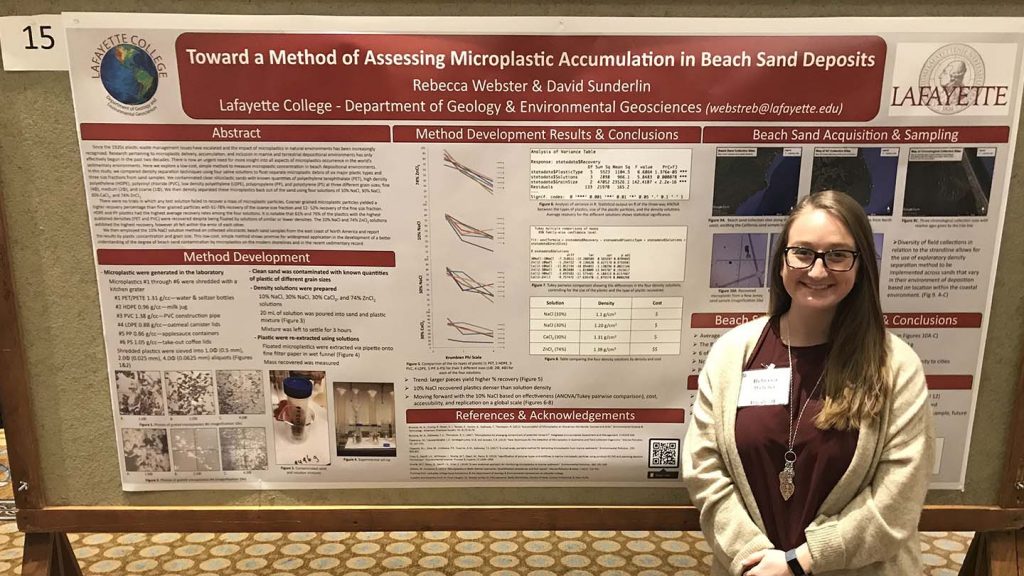
“Having this overall experience will allow me to critically think for myself to analyze and solve problems,” says Rebecca Webster.
My advisor: Sunderlin
My research: Toward a Method of Assessing Microplastic Accumulation in Beach Sand Deposits
What that means: “My research entailed developing and then implementing a method by which to extract microplastics from beach sand deposits. I wanted to place emphasis on the method being simple to use, low cost, and also effective, so that anyone could go out to their local beach, collect a sample of sand, and test it themselves to see how many microplastics particles are present in the sand. I came up with the method used being a density separation technique using a 10% NaCl solution. This is important, as this low-cost, simple NaCl method shows promise for widespread application in the development of a better understanding of the degree of beach sand contamination by microplastics on the modern shorelines and in the recent sedimentary record.”
What I found: “There were two major findings for this research. The first pertaining to developing a method and realizing that denser, more expensive solutions did not perform statistically better than cheaper, less dense solutions. So, deciding to move forward with the 10% NaCl solution was the result of the method development/ experimentation phase. The second major finding occurred after I tested 13 sand samples from along the east coast and two samples from the west coast of the United States. Out of 150 grams of beach sand from each location, there were an average of 2.5 microplastic particles recovered, with a variance of only 1.2 microplastic particles (which is staggering!). These findings suggest that microplastics are absolutely infiltrating their way into the rock record.”
My biggest challenge: “I think the hardest part of my research has been trying to communicate the ubiquity of microplastic pollution and why it is important to understand how microplastics are being transported and deposited in the environment. There is a sense of urgency that I have felt regarding the amount of microplastic particles that have been recovered from my tested sand samples.”
What I learned: “Having this overall experience will allow me to critically think for myself to analyze and solve problems. I’ve enjoyed co-thinking with my adviser and thinking about all of the different directions that this research could take—as well as thinking about the broader impacts that this work has on recognizing the Anthropocene and how we as humans are changing and influencing the landscape. Next year, I plan on working as a geospatial technician for a company called Quantum Spatial down in Florida. I hope to use the knowledge and skills that I have gained from my research in this new job.”
2 Comments
I was impressed by the diversity of topics covered by the student research. They were nice presentations and the participants understood the benefits of presenting their work. Were I still active in my Mexican research, I would have been happy to fund Rebecca to extend her study to beaches of various ages to document the onset of the microplastic problem in time.
Send Leah to Mars for “ground-teething”.
Comments are closed.